
Now, on to this week’s content drop. For the full posting calendar, check out this week’s Content Playbook.
Or dive in below:
Social Media Templates
-
“I Need…” Featured Listing (Carousel)
-
Best Bars To Spend All day Watching Football in [Market] (Carousel)
-
Mortgage Rates Hit 14-Month High (Carousel)
-
Restaurants I’m Most Excited About Opening in [Market] (Carousel)
-
If You’re a Virgo, You’ll Love This House (Reel)
-
Hyperlocal/Business Breaking News Template (Static Post)
-
The Best Burgers in [CITY] That Aren’t From a Chain (Carousel)
Email + Blog
-
Email: Did your home gain or lose value this year?
-
Blog: Where Home Prices Rose & Fell in 2026
Social Media Templates
“I Need…” Featured Listing (Carousel)

🎯 How To
-
Open and Customize the template: “I Need…” Featured Listing (Carousel)
-
Customize the slides with photos from your listing that best match each “I need…” statement. Instead of over-explaining the home, choose images that show the feeling behind the feature: water, space, privacy, room to gather, and quiet.
-
Add your handle or username in the placeholder on each slide.
-
Customize each slide based on the strongest features of the home. You can swap the order, change the second line, or add more slides if the listing has more moments worth showing.
-
On the following pages, you will notice there are different size options depending on how you want to use the template, whether you are posting it as a carousel, using it as a reel, or posting it on TikTok.
-
-
Download slides from Canva and upload to social.
-
Download the slides from your Canva template as a PNG or JPEG file.
-
Upload on Instagram, Facebook, LinkedIn, or wherever you are most active.
-
-
Copy and paste the CAPTION below (edit as needed!).
-
Most people don’t start their home search by saying, “I need 3 bedrooms and 2 bathrooms.”
They start with a feeling. This house gives you a bunch.
-
-
Publish on social.
Best Bars To Spend All day Watching Football in [Market] (Carousel)
![Best Bars To Spend All day Watching Football in [Market] (Carousel).png](https://assets.skool.com/f/99bafab03f014d90b0792504967a8ea5/1b514b153712441c909c65859f92c3385d6efc114955411faf57f3e3275a7599.png "Best Bars To Spend All day Watching Football in [Market] (Carousel).png")
🎯 How To
-
Open and Customize the template: Best Bars To Spend All day Watching Football in [Market] (Carousel)
-
Customize the cover page by replacing [Market] with your city, town, neighborhood, or local area. Add your logo in the placeholder on the cover so the carousel feels branded and connected to you.
-
On the following slides, replace each bar placeholder with real local football bars, restaurants, breweries, or sports pubs you would actually recommend. Add one short line explaining why each spot is good for game day.
-
Swap the photos on each slide with visuals that match each bar: TV wall, bar interior, exterior sign, game-day crowd, wings, drinks, patio, or a quick photo from inside the spot.
-
On the following pages, you will notice there are different size options depending on how you want to use the template, whether you are posting it as a carousel, using it as a reel, or posting it on TikTok.
-
-
Download slides from Canva and upload to social.
-
Download the slides from your Canva template as a PNG or JPEG file.
-
Upload on Instagram, Facebook, LinkedIn, or wherever you are most active.
-
-
Copy and paste the CAPTION below (edit as needed!).
-
As someone who watches a lot of football, specifically the [insert team], I won’t just go to any bar.
I want to see the actual TVs, eat good food, and not spend four quarters pretending the tiny screen in the corner counts.
-
-
Publish on social.
Mortgage Rates Hit 14-Month High (Carousel)

🎯 How To
-
Open and Customize the template: Mortgage Rates Hit 14-Month High (Carousel)
-
Customize the carousel with your branding, source, and current mortgage rate data. Add your logo or social media handle in the placeholders on each slide if the template includes them.
-
Update the rate number on the graphic if needed so it matches the latest source you are using. You can also swap the cover image with a mortgage rate chart, home price graphic, housing market image, or any visual that clearly signals rates, affordability, or market pressure.
-
Use the following slides to give the honest, practical take.
-
On the following pages, you will notice there are different size options depending on how you want to use the template, whether you are posting it as a carousel, using it as a reel, or posting it on TikTok.
-
-
Download slides from Canva and upload to social.
-
Download the slides from your Canva template as a PNG or JPEG file.
-
Upload on Instagram, Facebook, LinkedIn, or wherever you are most active.
-
-
Copy and paste the CAPTION below (edit as needed!).
-
Mortgage rates just hit a 14-month high.
But here’s the reality: life doesn’t wait for mortgage rates to come down.
-
-
Publish on social.
Restaurants I’m Most Excited About Opening in [Market] (Carousel)

🎯 How To
-
Open and Customize the template: Restaurants I’m Most Excited About Opening in [Market] (Carousel)
-
Customize the carousel by replacing [Market] with your city, town, neighborhood, or local area. This template is built to help you post a fast, useful hyperlocal update around new restaurant openings people in your area will care about.
-
On the cover, keep the breaking-news style strong and easy to scan. You can add your logo, name, or social handle in the placeholders if the template includes them.
-
For the cover visual, you can keep the current style and update it with something local. In the circle placeholder, add a map screenshot showing where the new restaurant or area is located, and add an arrow pointing to the location.
-
You can use Hyperlocal Content AI at hyperlocalcontent.ai to look for upcoming establishments or restaurants in your local area, local business developments, and other new places worth posting about. Swap the photos or background images with visuals that match the story.
-
On the following pages, you will notice there are different size options depending on how you want to use the template, whether you are posting it as a carousel, using it as a reel, or posting it on TikTok.
-
-
Download slides from Canva and upload to social.
-
Download the slides from your Canva template as a PNG or JPEG file.
-
Upload on Instagram, Facebook, LinkedIn, or wherever you are most active.
-
-
Copy and paste the CAPTION below (edit as needed!).
-
3 restaurants opening in [Market] that locals are already talking about.
Which one are you trying first?
-
-
Publish on social.
If You’re a Virgo, You’ll Love This House (Reel)

🎯 How To
-
Open and Customize the template: If You’re a Virgo, You’ll Love This House (Reel)
-
Customize the Reel with listing clips that show the cleanest, most organized, most functional parts of the home.
-
Strong Hook Options:
-
If you’re a Virgo, you’ll notice these 5 things before the kitchen.
-
Only watch this if you’re a Virgo and love a house that actually makes sense.
-
For buyers who care about closets, clean lines, and where everything goes.
-
Virgos, this house was built for you.
-
-
-
For the rest of the Reel, choose clips that prove why a Virgo would love the home. Use the best listing features that feel organized, useful, calm, clean, or detail-oriented.
-
-
Download slide from Canva and upload to social.
-
Download the slide from your Canva template as an MP4 video.
-
Upload on Instagram, Facebook, LinkedIn, or wherever you are most active.
-
-
Copy and paste the CAPTION below (edit as needed!).
-
Only watch this if you’re a Virgo and you love a house with a plan.
-
-
Publish on social.
Hyperlocal/Business Breaking News Template (Static Post)

🎯 How To
-
Open and Customize the template: Hyperlocal/Business Breaking News Template (Static Post)
-
We have provided template options you can use, either for a new business opening in your local area or for a local development update.
-
Be sure to update all necessary placeholders like the [CITY], [NEIGHBORHOOD], [BUSINESS NAME], [SOURCE], [PROJECT NAME], and any other local details so the post feels accurate, relevant, and specific to your market.
-
For the visual, use a local image, storefront rendering, business logo if allowed, map screenshot, or a generic illustrated placeholder in the circle.
-
If you’re not sure what local updates to feature, you can use the Hyperlocal Content AI Tool at hyperlocalcontent.ai to find local news, new stores opening, development updates, and other market-specific stories worth posting about. Then, generate a script to record a green screen or fill in the carousel template for a static post.
-
On the following pages, you will notice there are different size options depending on how you want to use the template, whether you are posting it as a carousel, using it as a reel, or posting it on TikTok.
-
-
Download slides from Canva and upload to social.
-
Download the slides from your Canva template as a PNG or JPEG file.
-
Upload on Instagram, Facebook, LinkedIn, or wherever you are most active.
-
-
Publish on social.
The Best Burgers in [CITY] That Aren’t From a Chain (Carousel)
![National Cheeseburger Day in [Market] (Carousel).png](https://assets.skool.com/f/99bafab03f014d90b0792504967a8ea5/7d432ea086e14ec9ab2eb99f4625bd4df7b2ac6b112e435d86c40705204bccbe.png "National Cheeseburger Day in [Market] (Carousel).png")
🎯 How To
-
Open and Customize the template: The Best Burgers in [CITY] That Aren’t From a Chain (Carousel)
-
Customize the cover page by replacing [Market] with your city, town, neighborhood, or local area.
-
Additional Hook Option
-
The Best non-fast food burger in () is from ()
-
-
-
On the following slides, replace each placeholder with real local burger spots you’d actually recommend. Add the restaurant name, the exact burger order, why it made your list, and what it’s best for.
-
You can use the Hyperlocal Content AI Tool at hyperlocalcontent.ai to find the best local burger shops in your area, new burger spots opening, or local restaurant updates worth posting about.
-
Swap the photos on each slide with burger close-ups, restaurant exteriors, fries and burger shots, menu photos, table spreads, bar seating, patio shots, storefronts, or a photo of you holding the order.
-
On the following pages, you will notice there are different size options depending on how you want to use the template, whether you are posting it as a carousel, using it as a reel, or posting it on TikTok.
-
-
Download slides from Canva and upload to social.
-
Download the slides from your Canva template as a PNG or JPEG file.
-
Upload on Instagram, Facebook, LinkedIn, or wherever you are most active.
-
-
Copy and paste the CAPTION below (edit as needed!).
-
In honor of national cheeseburger day, these are my go-to spots here in (). What did I miss?
-
-
Publish on social.
🎯 How To
-
Copy and paste the email script below in your preferred working doc.
-
Edit as needed for your market.
-
Be prepared to reply to anyone who responds.
-
Personalize the sign-off and send to homeowners in your database.
Subject: Did your home gain or lose value this year?
Body of email:
Hi [First Name],
Depending on what you’ve seen online lately, you might think home prices are falling everywhere.
Home prices are actually up 2.1% nationally over the past year.
But that national average doesn’t showcase what’s happening locally. Some markets are up 5%, 6%, even 7%+, while others are down 1-2%.
So if you own a home, the number I’d want to know is: What’s happened to the value of my home over the past year?
That depends on things like:
-
Your neighborhood
-
Your home’s size and condition
-
How much inventory is nearby
-
What similar homes have sold for
-
How much buyer demand exists at your price point
You don’t have to be planning to sell to know the answer. I think it’s a number every homeowner should check at least once a year. It can be useful when you’re making decisions about renovations, insurance, refinancing, your equity, or simply planning what’s next.
If you’re curious, reply HOME VALUE with your address.
I’ll pull the recent sales around you and send you an updated estimate of what your home could be worth today.
Best,
[Your Name]
Blog
🎯 How To
-
Copy and paste the blog below into your preferred working doc.
-
Edit as needed for your market. Adjust the tone as needed to match your brand.
-
⬇️ Download the BLOG IMAGE HERE (3 options)
-
OPTIONAL: Embed interactive maps using the code provided below.
-
Upload to your website (meta description, keywords and title options included below).
Meta Description: National home prices rose 2.1% year-over-year in Q2 2026. Here’s how [Your Market] compares and what it means if you’re buying or selling.
Keywords: home prices 2026, house price appreciation, is the housing market crashing, home value trends 2026, FHFA house price index, [Your Market] real estate, home prices by state 2026, NAHB, home prices in [Your Market]
Title ideas:
-
Worried Your Home Is Losing Value? Here’s What the Data Actually Shows
-
Where Home Prices Rose (and Fell) the Most in 2026 & Where [Your Market] Fits
-
Is the Housing Market Crashing? Here’s What the New Data Shows
Scroll through your YouTube or X feed long enough, and you’ll no doubt see at least one dommer warning of an imminent housing crash. Some of them sound so convincing, too.
But the data on today’s housing market shows something completely different.
Home prices climbed 2.1% across the country over the past year. I’m looking at where prices are rising the fastest, at the state and city levels, and where they’re falling. And the National Association of Home Builders (NAHB) put out some maps that show exactly what’s going on.
You’ll see those below, along with state and city rankings on home price growth and what we’re seeing here in [Your Market], so you can make an informed decision on whether to buy or sell this year.
What’s Happening to Home Prices Right Now
According to the Federal Housing Finance Agency (FHFA), home prices are up 2.1% nationally compared to a year ago.
This is a little faster than the pace at the start of the year.
Prices also rose 0.3% since the first few months of this year. This slower pace suggests the market is settling into a steadier rhythm.
Home prices have gone up every single quarter since 2012. Even with higher mortgage rates and cost pressures over the past few years, prices have kept climbing in most of the country.
States Where Home Prices Are Rising (or Falling) the Fastest
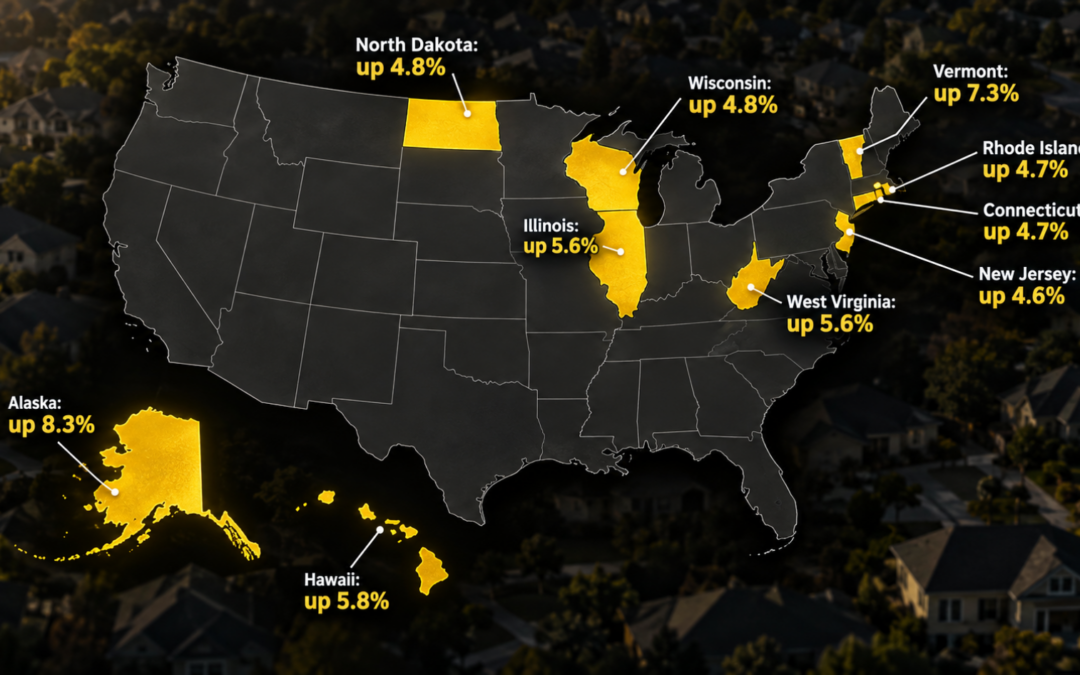
Some states are seeing much bigger gains than others. Here are the ten states with the strongest price growth over the past year:
-
Alaska: up 8.3%
-
Vermont: up 7.3%
-
Hawaii: up 5.8%
-
Illinois: up 5.6%
-
West Virginia: up 5.6%
-
Wisconsin: up 4.8%
-
North Dakota: up 4.8%
-
Connecticut: up 4.7%
-
Rhode Island: up 4.7%
-
New Jersey: up 4.6%
A lot of these states are in the Midwest or Northeast, where there aren’t enough homes for sale to keep up with buyer demand, and that keeps prices climbing.
Home prices fell in four states over the same year:
-
New Mexico: down 1.2%
-
Washington: down 0.9%
-
Colorado: down 0.5%
-
California: down 0.2%
A handful of other states, including Oregon, North Carolina, Texas, Mississippi, and Arizona, saw prices grow by less than 1% for the year. Many of these are the same markets that saw explosive growth during the pandemic, and they’re cooling off now.
Here’s NAHB’s map showing home price appreciation by state:
[***OPTIONAL: Embed code for NAHB state map]:
<div class='tableauPlaceholder' id='viz1788882712488' style='position: relative'><noscript><a href='https://eyeonhousing.org/'><img alt='Dashboard 1 ' src='https://public.tableau.com/static/images/St/State2026Q2/Dashboard1/1_rss.png' style='border: none' /></a></noscript><object class='tableauViz' style='display:none;'><param name='host_url' value='https%3A%2F%2Fpublic.tableau.com%2F' /> <param name='embed_code_version' value='3' /> <param name='site_root' value='' /><param name='name' value='State2026Q2/Dashboard1' /><param name='tabs' value='no' /><param name='toolbar' value='yes' /><param name='static_image' value='https://public.tableau.com/static/images/St/State2026Q2/Dashboard1/1.png' /> <param name='animate_transition' value='yes' /><param name='display_static_image' value='yes' /><param name='display_spinner' value='yes' /><param name='display_overlay' value='yes' /><param name='display_count' value='yes' /><param name='language' value='en-US' /></object></div> <script type='text/javascript'> var divElement = document.getElementById('viz1788882712488'); var vizElement = divElement.getElementsByTagName('object')[0]; if ( divElement.offsetWidth > 800 ) { vizElement.style.minWidth='420px';vizElement.style.maxWidth='900px';vizElement.style.width='100%';vizElement.style.minHeight='587px';vizElement.style.maxHeight='627px';vizElement.style.height=(divElement.offsetWidth*0.75)+'px';} else if ( divElement.offsetWidth > 500 ) { vizElement.style.minWidth='420px';vizElement.style.maxWidth='900px';vizElement.style.width='100%';vizElement.style.minHeight='587px';vizElement.style.maxHeight='627px';vizElement.style.height=(divElement.offsetWidth*0.75)+'px';} else { vizElement.style.width='100%';vizElement.style.height='877px';} var scriptElement = document.createElement('script'); scriptElement.src = 'https://public.tableau.com/javascripts/api/viz_v1.js'; vizElement.parentNode.insertBefore(scriptElement, vizElement); </script>
Cities Where Home Prices Are Rising (or Falling) the Fastest
City-level numbers show even bigger swings than the state data. Here are the ten cities with the biggest price gains over the past year:
-
Elgin, IL: up 7.7%
-
Allentown-Bethlehem-Easton, PA-NJ: up 7.0%
-
Bridgeport-Stamford-Danbury, CT: up 6.6%
-
Charleston-North Charleston, SC: up 6.5%
-
El Paso, TX: up 6.5%
-
Milwaukee-Waukesha, WI: up 6.1%
-
Chicago-Naperville-Schaumburg, IL: up 5.9%
-
New York-Jersey City-White Plains, NY-NJ: up 5.6%
-
Newark, NJ: up 5.5%
-
Greensboro-High Point, NC: up 5.3%
Some of these cities sit in states that didn’t make the state-level top ten, which shows how much prices can vary within a single state.
These ten cities saw the biggest price drops over the same year:
-
Everett, WA: down 3.7%
-
San Antonio-New Braunfels, TX: down 3.0%
-
Bakersfield-Delano, CA: down 2.6%
-
Seattle-Bellevue-Kent, WA: down 2.4%
-
San Francisco-San Mateo-Redwood City, CA: down 2.4%
-
Tucson, AZ: down 2.2%
-
Albuquerque, NM: down 1.7%
-
San Jose-Sunnyvale-Santa Clara, CA: down 1.6%
-
Washington, DC-Maryland: down 1.0%
-
Denver-Aurora-Centennial, CO: down 1.0%
A lot of these cities are in the West, in some of the same markets that saw the fastest growth a few years ago.
Some cities look very different depending on the time frame you use. San Francisco’s prices dropped 9.1% compared to the previous few months, even though its year-over-year drop was a smaller 2.4%. Short-term numbers can jump around a lot, so the year-over-year comparison gives a better sense of what’s happening.
Here’s the map showing city-level home price growth:
[***OPTIONAL: Embed code for NAHB metro map]:
<div class='tableauPlaceholder' id='viz1788884675679' style='position: relative'><noscript><a href='https://eyeonhousing.org/'><img alt='Dashboard 1 ' src='https://public.tableau.com/static/images/20/2026Q2_MSA/Dashboard1/1_rss.png' style='border: none' /></a></noscript><object class='tableauViz' style='display:none;'><param name='host_url' value='https%3A%2F%2Fpublic.tableau.com%2F' /> <param name='embed_code_version' value='3' /> <param name='site_root' value='' /><param name='name' value='2026Q2_MSA/Dashboard1' /><param name='tabs' value='no' /><param name='toolbar' value='yes' /><param name='static_image' value='https://public.tableau.com/static/images/20/2026Q2_MSA/Dashboard1/1.png' /> <param name='animate_transition' value='yes' /><param name='display_static_image' value='yes' /><param name='display_spinner' value='yes' /><param name='display_overlay' value='yes' /><param name='display_count' value='yes' /><param name='language' value='en-US' /></object></div> <script type='text/javascript'> var divElement = document.getElementById('viz1788884675679'); var vizElement = divElement.getElementsByTagName('object')[0]; if ( divElement.offsetWidth > 800 ) { vizElement.style.minWidth='420px';vizElement.style.maxWidth='900px';vizElement.style.width='100%';vizElement.style.minHeight='587px';vizElement.style.maxHeight='627px';vizElement.style.height=(divElement.offsetWidth*0.75)+'px';} else if ( divElement.offsetWidth > 500 ) { vizElement.style.minWidth='420px';vizElement.style.maxWidth='900px';vizElement.style.width='100%';vizElement.style.minHeight='587px';vizElement.style.maxHeight='627px';vizElement.style.height=(divElement.offsetWidth*0.75)+'px';} else { vizElement.style.width='100%';vizElement.style.height='727px';} var scriptElement = document.createElement('script'); scriptElement.src = 'https://public.tableau.com/javascripts/api/viz_v1.js'; vizElement.parentNode.insertBefore(scriptElement, vizElement); </script>
Why Some Markets Are Heating Up and Others Are Cooling Off
Two things are driving most of what we’re seeing in this data.
#1. Affordability
Buying a home costs more than it used to, and that’s pricing some buyers out or pushing them to wait. This is most visible in expensive markets like California and parts of the Pacific Northwest, where prices have already climbed a lot over the past several years.
#2: Housing supply
In a lot of Midwest and Northeast markets, there aren’t enough homes for sale to meet buyer demand. When supply is tight, prices tend to hold steady or keep climbing.
This helps explain why states like Illinois and Wisconsin keep appearing near the top of the growth list. States like Oregon and Arizona are dealing with a different set of pressures. Prices climbed fast in these places during the pandemic, and affordability still hasn’t caught up.
What This Means for [Your Market]
*** Agent note: Insert your own local price data here if you have it. A number specific to your neighborhood will mean more to your audience than any national or state figure. For example:
In [Your Market], home prices have [gone up/dropped] by [X percentage] from last year.
If you’re selling in [Your Market], knowing whether prices are climbing or slowing down here can help you set the right asking price and choose the best time to list.
If you’re buying, this same data can help you understand whether you’re negotiating in a market that favors you or one where you’ll need to move fast.
No home price story looks exactly the same from one house to the next, even within the same city. Your street, your school district, and your type of home all play a role in your home’s current value.